


16 Mar From Mauna Loa to Hoover Dam

In June last year a call from a friend I had not heard from since he left Jakarta around Y2k precipitated an unexpected journey. He had retired, was living in Las Vegas, and suggested that I should come and stay. That seemed like a good idea. Hawaii was on the way, and I had been looking for an excuse to visit the National Oceanic and Atmospheric Administration (NOAA) observatory on Mauna Loa ever since publishing my book on climate science, Wind, Sun and Nuclear, six months earlier. I was also keen to attend the opening matches of the Australian National Rugby League (NRL) season, which in recent years have been staged in Las Vegas as part of the league’s efforts to promote the sport internationally.
The long record of carbon dioxide measurements from Mauna Loa is the foundation of modern climate science. Before these observations began in the late 1950s, scientists suspected that human activities were increasing atmospheric carbon dioxide, but the evidence was limited and fragmentary. The continuous measurements initiated by the geochemist Charles David Keeling provided the first clear demonstration that CO₂ concentrations in the global atmosphere were steadily rising. Because the observatory samples clean background air representative of large regions of the atmosphere, the resulting record offers a reliable measure of long-term change in atmospheric composition. Over time the Keeling Curve has therefore become one of the most important empirical records in climate research.
Unfortunately, Mauna Loa is an active volcano and when I called the NOAA office in Hilo, I was advised that it had erupted in late 2022. Lava flows from the eruption had cut the road to the observatory and it remained impassable. Instead, I was encouraged to visit the astronomical observatories on nearby Mauna Kea and to call in at the NOAA office in Hilo.
I eventually arrived in February. The journey up Mauna Kea took us above the cloud layer into a stark volcanic landscape more than 13,000 feet above sea level. From the summit observatory precinct we watched the sunset beside the Canada–France–Hawaii Telescope. To the west the distant slopes of Mauna Loa were faintly visible, and although I had not reached the atmospheric observatory itself, I felt I had gained a clearer sense of the setting in which Keeling’s remarkable measurements had begun.
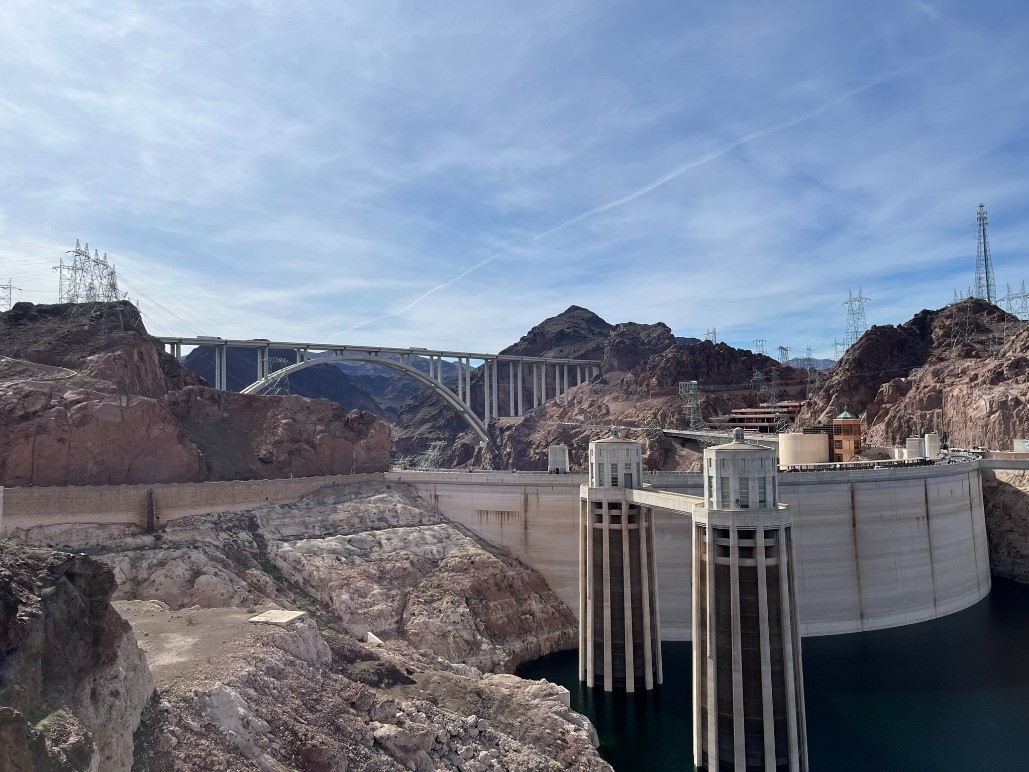
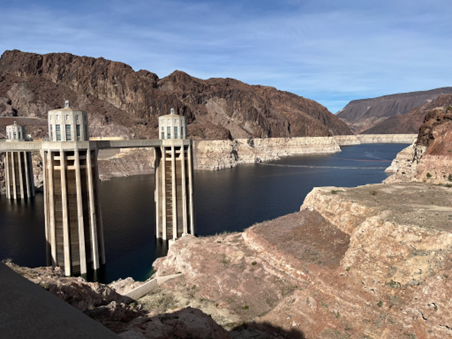
Days later I was in Las Vegas and my host had no difficulty persuading me to pay my respects at Hoover Dam. What a piece of work is man! The concrete arch gravity dam, the spillways, the intake towers, the penstocks, the twin powerhouses and the spectacular bypass bridge. It makes one proud to be an engineer. But standing on the dam and looking out across Lake Mead one couldn’t help noticing a feature the engineers may not have anticipated, a pale “bathtub ring” around the surrounding cliffs marking how far the reservoir has fallen below its historical high-water level.
These two observations – the steady rise of atmospheric carbon dioxide recorded at Mauna Loa and the visible decline in the level of Lake Mead behind Hoover Dam – might at first seem unrelated. Yet they may in fact be connected. Rising atmospheric carbon dioxide contributes to global warming, and changing temperatures can influence the hydrology of the western United States. This essay explores the possible links between the atmospheric measurements made at Mauna Loa and the changing water levels of Lake Mead behind Hoover Dam.
The Mauna Loa Observatory occupies a unique position in climate science. Located on the northeastern flank of the Mauna Loa volcano on the Big Island of Hawaii, the observatory sits at an elevation of about 3,400 metres (approximately 11,000 feet) above sea level. Its remote location in the middle of the Pacific Ocean and its high altitude make it an ideal site for monitoring the background composition of the Earth’s atmosphere.
The observatory lies above the marine inversion layer that traps much of the moisture and pollution associated with surface conditions closer to sea level. As a result, the air sampled at Mauna Loa is generally representative of the well-mixed atmosphere over large regions of the globe rather than local sources of contamination. The surrounding landscape consists largely of bare volcanic rock with very little vegetation, which further reduces local influences on atmospheric carbon dioxide levels.
These characteristics led the geochemist Charles David Keeling of the Scripps Institution of Oceanography to establish continuous measurements of atmospheric carbon dioxide at Mauna Loa beginning in 1958. The resulting record, now widely known as the Keeling Curve, shows a steady and persistent increase in atmospheric CO₂ concentration over time. In the early 1980s atmospheric carbon dioxide concentrations were around 340 parts per million; today they exceed 420 parts per million. This increase reflects the cumulative effects of human activities, particularly the combustion of fossil fuels and changes in land use.
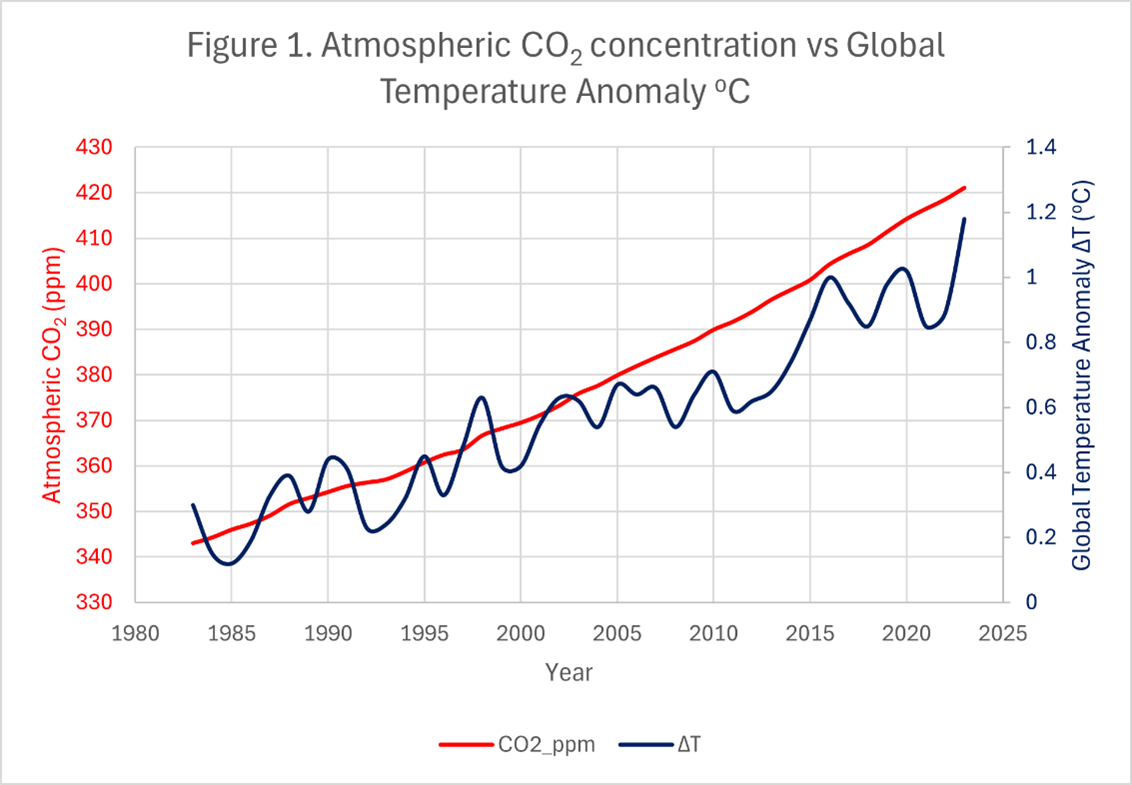
Carbon dioxide is a greenhouse gas that absorbs and re-emits infrared radiation in the atmosphere, helping to retain heat within the Earth’s climate system. Over the past several decades the rise in atmospheric CO₂ has been accompanied by a measurable increase in global average temperature.
This relationship is illustrated in Figure 1, which compares atmospheric carbon dioxide concentrations measured at Mauna Loa with the global temperature anomaly since the early 1980s. The global temperature anomaly measures how much the Earth’s average temperature differs from a long-term historical baseline, with sustained warming becoming evident from the late 1970s onward. Although temperatures fluctuate from year to year because of natural variability in the climate system, the long-term trend shows a clear upward movement that broadly parallels the increase in atmospheric CO₂ concentration.
Changes in global temperature influence a wide range of environmental systems, including precipitation patterns, snow accumulation in mountain regions, and the timing of seasonal runoff. In regions where river systems depend heavily on winter snowpack, such changes can have important consequences for water supply.
Much of the water that ultimately flows through the Colorado River basin originates as snowfall in the high mountains of Colorado, Wyoming, and Utah. During winter this precipitation accumulates as snowpack, which acts as a natural storage system. As temperatures rise in the spring and early summer, the gradual melting of this snow feeds the rivers and streams that supply the Colorado River.
Temperature changes can influence both the amount of snow that accumulates and the timing of its melt. Warmer winters may reduce the proportion of precipitation that falls as snow rather than rain, while warmer spring temperatures can cause snowmelt to occur earlier in the year. Both effects can alter the seasonal pattern of runoff entering the Colorado River system.
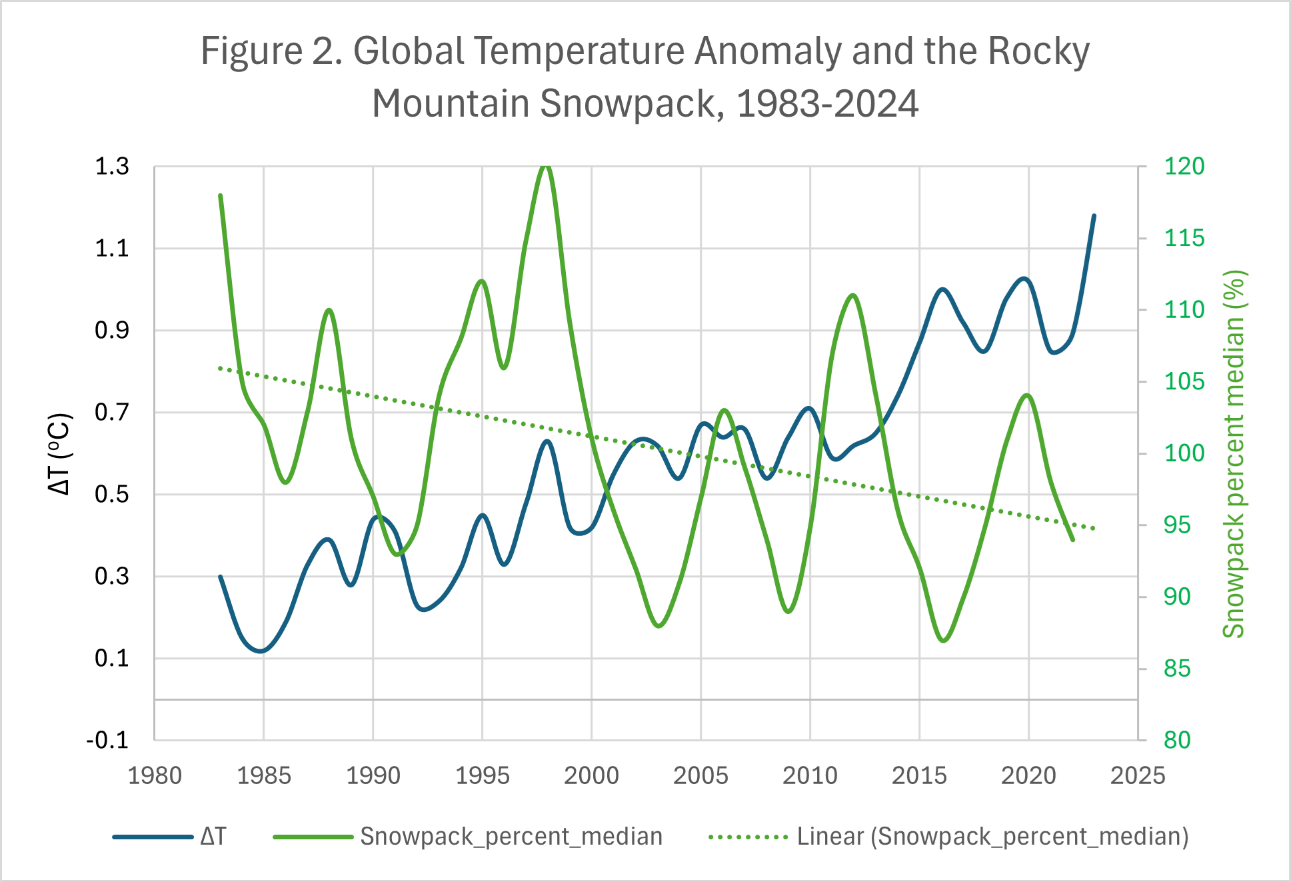
The relationship between rising temperatures and Rocky Mountain snowpack is illustrated in Figure 2, which compares the global temperature anomaly with measurements of snowpack expressed as a percentage of the historical median. Although the snowpack record shows considerable year-to-year variability, the longer-term pattern suggests a gradual decline over the past several decades.
Because the Colorado River depends heavily on runoff from these mountain regions, even modest changes in snowpack can influence the amount of water eventually reaching reservoirs such as Lake Mead.
The water stored in Rocky Mountain snowpack ultimately feeds the Colorado River which flows southwest through Utah and Arizona before reaching Lake Mead behind Hoover Dam. During winter precipitation accumulates in the mountains as snow, and the gradual melting of this snow during spring and early summer supplies much of the water that enters the river system.
When Hoover Dam was completed in 1936 its purpose was to regulate the highly variable flows of the Colorado River. Seasonal flooding had historically made the river difficult to manage for agriculture and settlement. By impounding the river, Lake Mead created a large storage reservoir that allowed water to be delivered more reliably to downstream users. In effect the reservoir moderates the natural variability of the river, storing water in wetter years and releasing it during drier periods.
The amount of water stored in Lake Mead therefore depends on two principal factors: the volume of water entering the reservoir from the Colorado River system and the amount withdrawn for irrigation, municipal supply, and other uses throughout the southwestern United States.
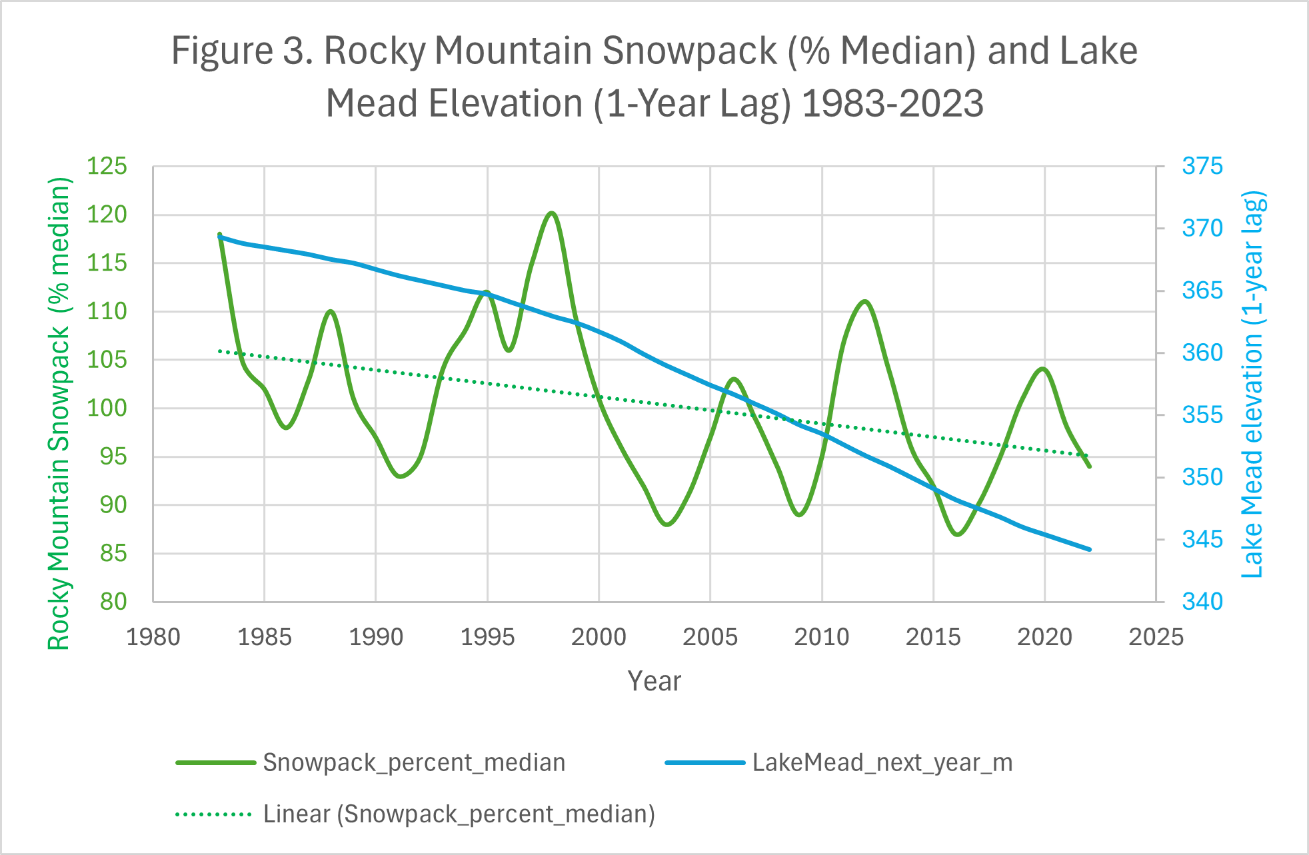
Figure 3 compares Rocky Mountain snowpack with the elevation of Lake Mead in the following year. The one-year lag reflects the time required for snow accumulated in the mountains to melt, flow through the river system, and influence the level of water stored in the reservoir. Although the relationship is not exact, variations in snowpack are reflected in subsequent changes in the level of Lake Mead.
At the same time, the figure suggests that the long-term decline in Lake Mead’s elevation cannot be explained by snowpack variations alone. Even in years when snowpack approaches or exceeds the historical median, the reservoir level often continues to fall. This indicates that the balance between inflow and withdrawals has gradually shifted over time.
The result is a slow but persistent decline in the elevation of Lake Mead over past decades. The pale “bathtub ring” around the reservoir is a striking reminder of this change. It marks the levels reached during earlier periods when the reservoir held significantly more water than it does today. Without the water represented by this “bathtub ring,” Lake Mead is now only about 37 percent full, containing roughly 12 cubic kilometres of water.
Lake Mead plays a central role in the management of water resources in the American Southwest. Water released from Hoover Dam supplies irrigation systems and municipal water networks in Arizona, Nevada, and California. Cities such as Las Vegas, Phoenix, and Los Angeles depend on this supply, while large areas of irrigated agriculture in the lower Colorado River basin also draw upon it.
Because of its importance, Lake Mead is managed according to a set of operational thresholds that correspond to particular reservoir elevations. When the water level falls below these thresholds, specific management actions are triggered. These may include reductions in water allocations to states or limits on hydroelectric power generation.
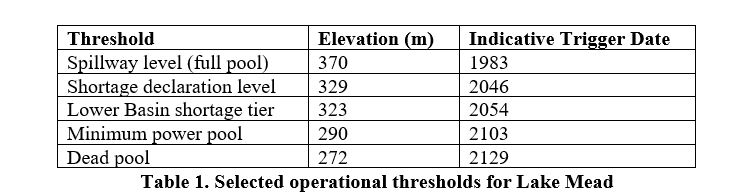
Table 1 summarises several of the commonly cited operational thresholds for Lake Mead. It also shows the approximate years in which these levels would be reached if the historical decline in reservoir elevation observed since the early 1980s were simply extended into the future. These projections are not forecasts, but they provide a useful indication of the time scales involved.
The table suggests that although Lake Mead has declined significantly from its historical high-water levels, the most critical operational thresholds remain decades away assuming current trends continue. The reservoir is therefore not facing an immediate crisis. Nevertheless, the gradual downward trajectory indicates that the balance between water inflow and water demand within the Colorado River system has shifted over time.
Understanding the reasons for this shift requires examination of both sides of the equation: the amount of water entering the system and the amount withdrawn.
The gradual decline in Lake Mead’s elevation over the past several decades is likely the result of a combination of factors rather than a single cause. On the inflow side of the equation, changes in Rocky Mountain snowpack influence both the amount and timing of water entering the Colorado River system. Even relatively modest reductions in snow accumulation, or earlier spring melting, can alter the seasonal pattern of runoff.
At the same time, demand for water has increased substantially since Hoover Dam was completed in the 1930s. The dam and reservoir made it possible to support large urban populations and extensive irrigated agriculture in regions that would otherwise have been far more difficult to develop. Cities such as Las Vegas, Phoenix, and Los Angeles have grown dramatically, while agricultural production in the lower Colorado River basin has also expanded.
As a result, the reservoir now operates under climatic conditions and patterns of water use that differ significantly from those prevailing when Hoover Dam was originally designed. Lake Mead’s bathtub ring therefore reflects the interaction between natural hydrological variability and the growing demand for water.
When Hoover Dam was completed in 1936 it represented one of the most ambitious engineering projects of its time. Constructed during the depths of the Great Depression, the dam was built in just four years and transformed the management of the Colorado River. By controlling seasonal flooding and creating a vast storage reservoir in Lake Mead, the project made it possible to support large-scale agriculture and rapidly growing cities throughout the American Southwest.
The system Hoover Dam helped create has proved remarkably durable. For nearly a century the reservoir has moderated the natural variability of the Colorado River, storing water in wet years and releasing it during periods of drought. In doing so it has provided a degree of stability to a region where water availability had historically been uncertain.
The gradual decline in the level of Lake Mead observed over the past several decades does not imply that the reservoir is close to failure. As the threshold levels in Table 1 suggest, the most serious operational limits remain some distance in the future if current trends continue. Nevertheless, the downward trend does raise questions. Demand for water has increased substantially and the possibility that changing climatic conditions may influence snowpack and runoff patterns introduces additional uncertainty into the system.
Seen in this context, the falling level of Lake Mead is less a sign of immediate crisis than an indication that the balance between water supply and water demand may be evolving. Addressing that balance will likely require a combination of improved water management, technological adaptation, and continued attention to the broader environmental factors that influence the Colorado River basin.
The observations that prompted this essay began in two very different places. At Mauna Loa Observatory in Hawaii, scientists measure the steady rise of atmospheric carbon dioxide, producing one of the most important long-term records of change in the Earth’s atmosphere. At Hoover Dam in Nevada, the pale “bathtub ring” around Lake Mead reveals a gradual decline in the level of one of the largest reservoirs in North America.
Taken together, these observations suggest a possible connection between global atmospheric change and regional hydrological systems. Rising concentrations of carbon dioxide have been accompanied by increasing global temperatures. These changes may influence the snowpack of the Rocky Mountains, which acts as the natural reservoir for the Colorado River system. In turn, variations in snowpack and growing water demand affect the level of water stored behind Hoover Dam.
The evidence presented here does not suggest an imminent failure of the reservoir system. Rather, it illustrates how long-term environmental changes can gradually influence the infrastructure on which modern societies depend. The connection between Mauna Loa and Hoover Dam therefore serves as a reminder that global atmospheric processes and regional water systems form part of the same interconnected Earth system.
Understanding these connections may help inform the choices that will shape the future management of the Colorado River and the communities that depend upon it. I would give AI a go. You never know, it might come up with a practical solution that doesn’t require a penny of capital expenditure.
Data Sources
- NOAA Global Monitoring Laboratory. Atmospheric CO₂ measurements at Mauna Loa Observatory.
- NASA Goddard Institute for Space Studies. Global Surface Temperature (GISTEMP) dataset.
- Natural Resources Conservation Service (NRCS). Rocky Mountain snowpack measurements (SNOTEL network).
- U.S. Bureau of Reclamation. Lake Mead reservoir elevation and storage data.
Thomas Anthony Norcliffe
Posted at 19:38h, 16 MarchDear David, thank you for an interesting and pertinent essay. I often query the extent to which the increase of Carbon Dioxide in our atmosphere contributes to global warming. I consider that solar activity (sunspots and solar explosions) and the changing orbit of the Earth round the sun may offer a more sensible reason for global warming. In Roman times it has been shown scientifically that The UK was warmer than it is today and vines were being grown in Scotland to make wine! In the Middle Ages we see pictures of the Thames frozen over with fairs being held on the ice and this surely cannot be the result of Carbon Dioxide increase! A cyclical change indeed.
I query therefore the logic of Ed Miliband covering our UK countryside with wind farms when we need the land to grow food and his reluctance to use the North Sea deposits. This policy is one big cause of our failing UK economy
Hope to see you in Cape Town soon