


24 Oct Renewables vs Nuclear for the NEM

A Cost Comparison for the Select Committee on Nuclear Energy
Summary
‘Average capacity factors’ and unit costs from CSIRO’s GenCost 2023-24 report have been adopted to estimate and compare capex for AEMOs planned ‘renewable energy 2050’ network with an equivalent nuclear energy network. The calculated ‘dispatchable power output’ based on average capacity factors from each scenario is 66 GW. The calculated ‘renewable’ option capex is $482 billion. The calculated ‘nuclear’ option capex is $573 billion.
Operating experience since 2011 has shown the installed assets are not achieving the GenCost ‘average capacity factors’ so the calculations have been reworked using “revised capacity factors”. The calculated ‘dispatchable power output’ based on revised capacity factors from each scenario is 57 GW. The calculated ‘renewable’ option capex is $482 billion. The calculated ‘nuclear’ option capex is $480 billion.
These calculations confirm that renewable energy options are not necessarily less expensive than equivalent nuclear options.
Report and Calculations
To achieve its commitment to net zero carbon emissions by 2050 the Australian Government has embarked on a programme to replace coal fired power stations with predominantly wind and solar power. The plan for this transition is detailed in the Australian Energy Market Operator’s report entitled 2024 Integrated System Plan for the National Electricity Market. [1]
According to AEMO its plan is ‘the lowest cost way to supply electricity to homes and businesses through Australia’s transition to a net zero economy’ is ‘renewable energy connected by transmission, firmed with storage and backed up by gas-fired generation’. It calls for 213 GW of wind and solar generation backed up by 22 GW of Flexible Gas and Hydro by 2050.
The Australian Opposition believes the renewables network being developed by the government will be unreliable. They are worried it lacks the necessary backup and is only avoiding blackouts for the time being because there is still 23 GW of coal fired capacity in the mix. This will be gone in ten years at which time Australia’s renewable energy backup from flexible gas and hydro will be just 10%. Denmark and Ireland which have also opted for renewable power futures are doing so because they can rely on 120% backup from neighbours. Australia doesn’t have neighbours so the answer, according to the opposition, is nuclear power.
They have proposed installing reactors on seven abandoned coal fired power station sites. As of today, October 2024, this is all we know but it is possible to use data provided by the CSIRO’s GenCost 2023-24[2] report to compare the cost of the government’s renewable plan with the cost of an equivalent nuclear plan.
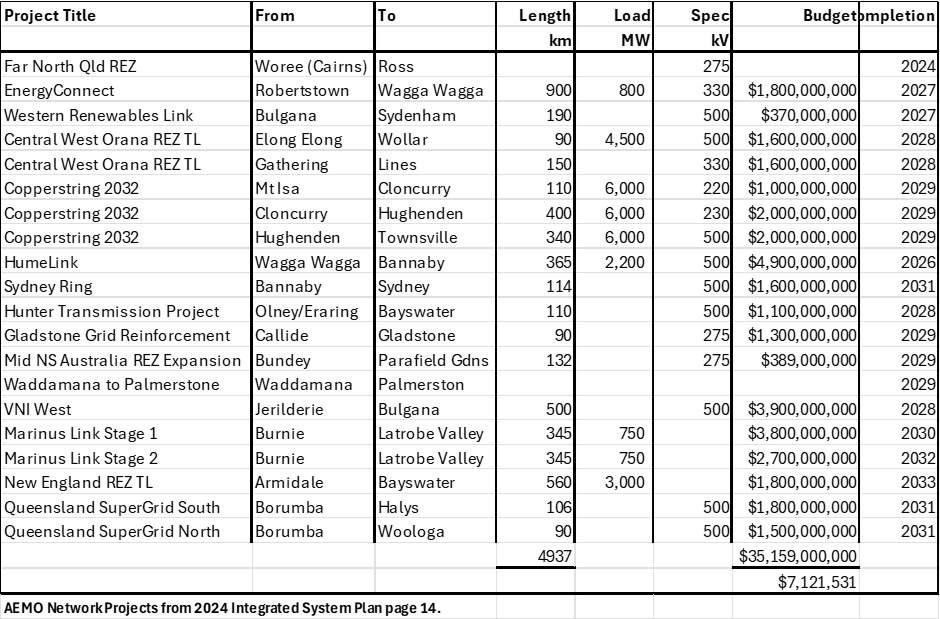
An essential unit cost item common to both plans will be the cost of ‘rewiring the nation’. AEMO’s 2024 Integrated System Plan for the National Electricity Market indicates that, by 2050, 10,000 km of transmission lines will have been installed to connect the planned wind and solar farms to the grid. Almost half these transmission line projects have been identified in AEMO’s plan and are tabled below. The average cost of one kilometre of transmission line comes out at $7.1 million. For the purposes of comparing renewables with nuclear it has been assumed that a nuclear network will require just 5,000 km of transmission lines.
Table 1. Network projects in the 2024 ISP optimal development path
The basic elements of AEMO’s plan to transition to net zero 2050 with ‘renewable energy connected by transmission, firmed with storage and backed up by gas-fired generation’ are tabled below (Table 2) together with an estimate to provide the same quantity of dispatchable power with zero-emission nuclear power generation plants. The calculations assume that 86 GW of rooftop solar, and 7 GW of hydro power are common to both scenarios and that the renewables and nuclear scenarios will require ten and five thousand kilometres of transmission lines respectively.
If the average capacity factors and CAPEX costs published in the GenCost 2023-2024 report are applied, AEMO’s planned 220 GW of renewable capacity will provide 66 GW of dispatchable power at a cost of $482 billion. This is 9 GW short of the 75 GW called for in the AEMO plan but still sufficient to supply the anticipated annual demand of 410 TWh called for in the same plan.
Table 2. Renewables Capex vs Nuclear Capex
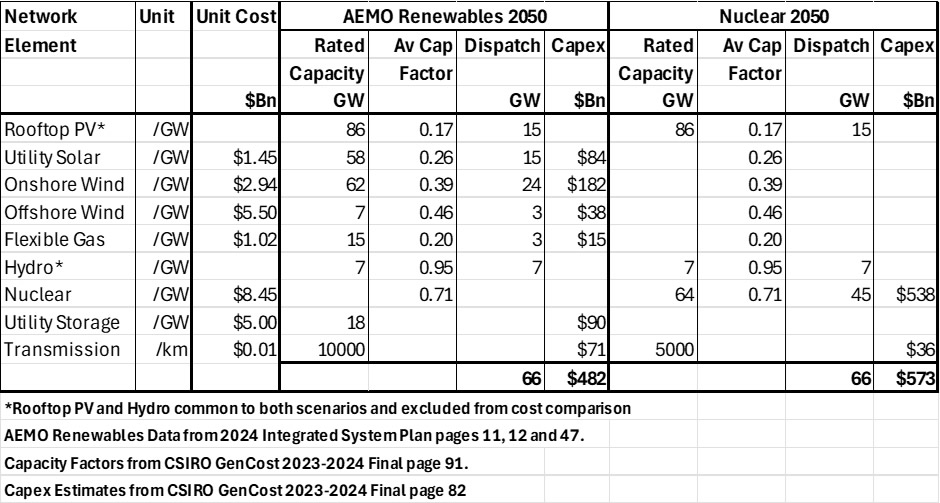
On the basis that 86 GW of Solar PV and 7 GW of hydro are common to both the renewables and nuclear scenarios, 64 GW of nuclear which will supply 45 GW of dispatchable power will be required to provide a total of 66 GW of dispatchable power for the nuclear scenario at a cost of $573 billion. These numbers don’t include operating costs but since the capex gap is reasonably wide and since there are negligible fuel costs it would not be unreasonable to assume the renewables LCOE will be less than that for nuclear. So, based on this analysis renewables should be the preferred option and, burgeoning electricity costs aside, so far so good. But that’s because there is still enough coal-fired capacity to cover for the problems that are already surfacing as new wind and solar projects are commissioned. This will only get worse as coal-fired cover recedes and the point of no return comes and goes.
As can be derived from Table 2, AEMO’s plan for net zero 2050 is for 213 GW of wind and solar backed up by 22 GW of gas and hydro, that’s 10% firm power back up and there is no big brother next door to come to the rescue when things go wrong. And they do. Capacity factors have been overestimated, transmission losses have been underestimated, and there is already output curtailment around noon each day as an oversupply of solar generated power overwhelms the fragile elements of the grid.
The conversion from ‘Rated Capacity’ to ‘Dispatch’ (dispatchable power) in Table 2 adopts the average capacity factors tabled in CSIRO’s GenCost 2023‐24 report. Accordingly, 62 GW of onshore wind, with an ‘average capacity factor’ of 39%, converts to 24 GW of dispatchable power. The first onshore wind project in eastern Australia was installed in 2011. Since then, 13.3 GW of the 62 GW of onshore wind planned for 2050 has been installed. AEMO has been monitoring performance and the achieved capacity factor for the installed assets has been oscillating around 30%, not the 39% mentioned above[3]. This means that when installed, 62 GW of onshore wind capacity will be delivering 19 not 24 GW of dispatchable power.
Offshore wind farms are yet to arrive in Australia but there is no reason to believe they will achieve the average capacity factors cited in GenCost 2023‐24 report. For the purpose of this evaluation, it will be assumed the ‘average capacity factor’ of 46% will, in practice, come down to 35% commensurately with the reduced performance of onshore wind farms.
‘Network losses’ are mentioned twice but not quantified in AEMO’s 2024 Integrated System Plan and absent altogether from CSIRO’s GenCost 2023‐24: Final report but they are real and mean not all the power generated in regional areas reaches the consumer. It is assumed, however, that the observed capacity factor of 30% for onshore wind includes network/transmission losses and ditto for the inferred offshore wind capacity factor.
In the networks connecting eastern Australia’s remote renewable energy assets to major market centres, transmission losses are a significant issue, particularly due to the long distances involved and the capacity of the lines used. These losses can account for up to 10% of the electricity generated, depending on factors such as the distance the power travels, the voltage and resistance of the transmission lines, and the amount of power flowing through the grid. Efforts to reduce these losses include building more high-voltage transmission lines (refer Table 1) but this will not completely eliminate the problem.
Then there is the “curtailment” problem. Renewable Energy Zones (REZs) in Australia’s eastern states are designed to coordinate the development of large-scale renewable energy projects (like solar, wind, and storage) with the required grid infrastructure. These zones will help concentrate renewable energy generation in areas with high-quality wind and solar resources, allowing for efficient transmission to major demand centres.
It sounds like a good idea and makes a lot of sense but on sunny days particularly around noon both solar and wind farm operators have problems getting their power to market through overloaded transmission lines and when they do there is no market for the power anyway. So, they shut down and these shutdowns can last for weeks. From the investors point of view its revenue that can never be recovered unless they install batteries which are expensive.
For the purposes of this evaluation the average capacity factor for rooftop solar and utility solar will be reduced by 10% to account for transmission losses and curtailment. Therefore, the revised capacity factors for rooftop solar and utility solar will be 15% and 23%
Table 3 recalculates the dispatchable power available from the AEMO renewables plan adopting revised capacity factors derived above. This reduces dispatchable power from 66 GW to 57 GW for the same cost as before i.e. $482 Billion. This will produce 498 TWh in 2050 which will satisfy the anticipated demand of 410 TWh.
Table 3 Renewables Capex vs Nuclear Capex with Revised Capacity Factors
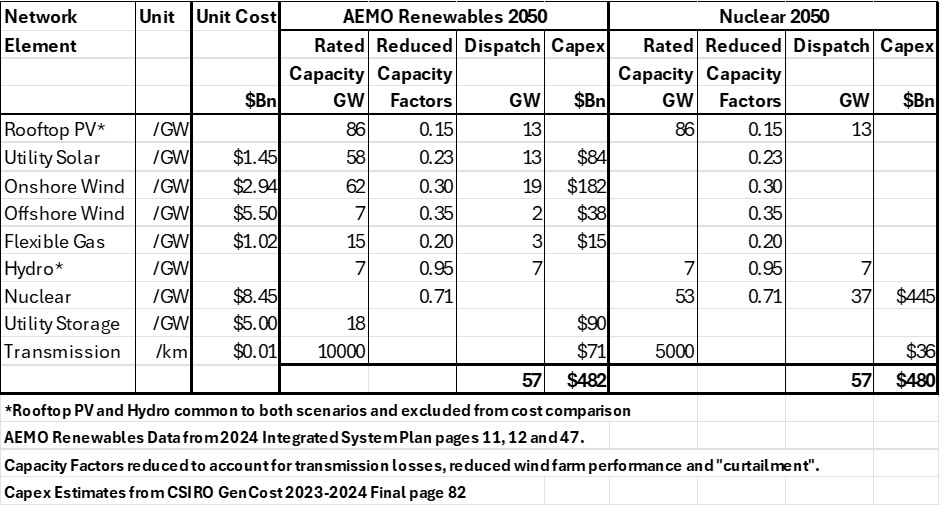
To match this requires just 53 GW of nuclear with an all-in cost of $480 billion (Table 3). Hey presto, nuclear becomes the cheaper option obviating the necessity for 15 GW of ‘Flexible Gas’ thereby saving five million tonnes of CO2 annually. Table 3 demonstrates the government’s plan to transition to net zero with ‘renewable energy connected by transmission, firmed with storage and backed up by gas-fired generation’ could be replaced by a nuclear option for
less without gas-fired back up. It’s not suggested that Australia should abandon its current plan for renewables entirely, but that nuclear become an important element of the mix. This will provide Australia with a robust power generation network and a path to real zero.
[1] Australian Energy Market Operator, 2024 Integrated System Plan, June 2024.
[2] Graham, P., Hayward, J. and Foster J. 2024, GenCost 2023‐24: Final report, CSIRO, Australia.
[3] Paul Mcardle, An updated look at monthly NEM-wide wind statistics, Watt Clarity, https://wattclarity.com.au/articles/2024/09/08sept-monthly-wind-statistics/, accessed 22/10/2024.
Revision 1. 24 October 2024
Nicola Fleming
Posted at 08:45h, 30 AprilAnother interesting article, thanks David for your insight.